Suicide Prevention Must Expand Beyond Crisis Intervention. Interpreting the latest suicide data. Reviewed by Davia Sills

KEY POINTS-
- The number of suicides in the U.S. climbed 2.6 percent in 2022, to just under 50,000.
- The suicide rate has been climbing steadily since 2000.
- Men are four times more likely than women to die by suicide.
- Men in non-urban areas are particularly at risk of suicide due to social and economic factors.

We’re past the point of using metaphors like alarms and wake-up calls. They have been going off for years, and the provisional figures from the Centers for Disease Control and Prevention (CDC) on suicide in 2022 once again convey a grim increase in deaths that has been the general trend since 2000. Though the overall number of suicides declined in 2019 and 2020, the figure has once again risen in 2021 and 2022—by 5 percent and 2.6 percent, respectively.
There is no positive spin that one can put on the fact that just under 50,000 Americans chose to end their lives last year. And while there may not be a silver lining in this story, we at least have the epidemiological tools to better understand where more suicides are happening and who is more likely to die by suicide, which may eventually help us understand why the number of suicides is climbing. Though it is a category error to treat suicide as no different than a disease, there are most certainly social factors that are contributing to the rise in suicides, and they are affecting some communities more than others.

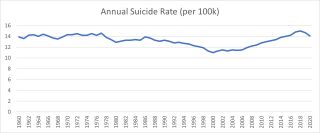
Three preliminary things are worth noting. First, while the number of suicides has trended upward since 2000 and may seem unprecedented, the annual suicide rate is similar to what it was for much of the 1960s and 1970s (see Figure 1).
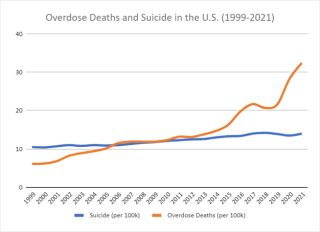
The second is that the rise in suicides since 2000 has been accompanied by an increase in the number of overdose deaths, which has accelerated more recently due to the rising presence of fentanyl in the illicit drug trade and the COVID-19 pandemic (see Figure 2). Moreover, many of the antecedent social factors propelling the rise in drug use and overdose deaths are almost certainly driving the surge in suicides.

Third, 90 percent of completed suicides occur in patients with a mental illness. However, the percentage of people who have a mental illness and take their own lives is only 5 percent. Moreover, an estimated 50 percent of suicide victims are people with no known psychiatric illness, even at their time of death.
All that said, here’s what the epidemiological data says.
Where?
Within the U.S., density appears to be inversely associated with suicide rates, with large metropolitan areas like New York seeing suicide rates half that of rural areas. As of 2021, the states with the highest suicide rates per 100,000 were Wyoming (32.3), Montana (32.0), and Alaska (30.8). The states with the lowest suicide rates were New Jersey (7.1 percent), New York (7.9 percent), and Massachusetts (8 percent). Alaska has the lowest population density, followed by Wyoming and then Montana. Conversely, New Jersey is the most densely populated state, New York ranks seventh, and Massachusetts ranks third.

Who?
As Figure 3 shows, men have been about four times more likely to die by suicide than women for the last 20 years. There are also clear racial and ethnic disparities in suicide rates; non-Hispanic Whites and Non-Hispanic American Indian or Alaska Natives have significantly higher rates than average, while Hispanic, Non-Hispanic Black, and Non-Hispanic Asian or Pacific Islander individuals all have lower than average rates.
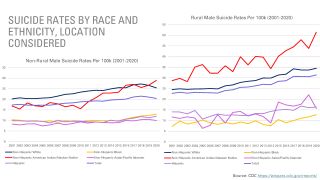
What is truly astonishing is what happens when you split ethnic groups along the rural or non-rural divide for men (see Figure 4). The graph on the right appears to be a continuation of the graph on the left, but it’s actually a visualization of this divide.

When?
While the non-rural or rural divide and patterns among ethnicities are fairly straightforward, age is not. Moreover, the age groups with the highest suicide rates skew a bit older than one might expect. Among women, it’s the 45 to 64 age group. For men, it’s those who are over 75. Additionally, every age group for females is lower than for males, except for those aged 10-14.
How?
Guns have become the most common method of suicide among both men and women within the U.S. In 2021, 54 percent (26,328) of all firearm deaths were suicides compared to 43 percent of deaths which were murders (20,958). The remaining 3 percent included accidents (549), shootings by police officers (537), or deaths with undetermined circumstances (458).
Raw Numbers
While rates fluctuate from year to year for varying groups, I want to stress that the largest number of suicides each year continues to be middle-aged White males who die by firearm in non-rural areas. Similarly, suicide rates within rural areas may be elevated, but the raw number of deaths is still far higher in non-rural areas because more people live there.
Takeaways
There is no doubt that there is a mental health crisis in America, and non-Hispanic American Indian/Alaskan Native and non-Hispanic White men in non-urban areas are perhaps struggling as much, if not more, than anyone else, as the data shows. For decades, unique cultural hurdles have prevented men in these communities from asking for help, such as stigmas against seeking assistance or limited access to mental health care. However, we have not seen the high suicide rates described above. Something else has to be fueling the problem.
It seems clear that the widely reported macroeconomic trends that have resulted in disproportionate levels of poverty, drug use, and despair are the issues driving the epidemic of non-urban suicide more than social stigmas. While this should not stop us from providing resources for short-term crisis intervention, long-term suicide prevention will require meaningful economic changes and a resurgence of hope.
If you or someone you love is contemplating suicide, seek help immediately. For help 24/7, dial 988 for the National Suicide Prevention Lifeline, or reach out to the Crisis Text Line by texting TALK to 741741.
- Questions and Answers
- Opinion
- Story/Motivational/Inspiring
- Technology
- Art
- Causes
- Crafts
- Dance
- Drinks
- Film/Movie
- Fitness
- Food
- Games
- Gardening
- Health
- Home
- Literature
- Music
- Networking
- Other
- Party
- Religion
- Shopping
- Sports
- Theater
- Wellness
- News
- Culture
- War machines and policy

